Ideas by Bridgeable
“Show, don’t tell”: Using storyboards to validate service concepts
At Bridgeable, incorporating storyboards in our validation process allows us to test insights in a short timeframe and maintain efficiency throughout. These tips streamline the preparation, implementation, and synthesis of testing with storyboards. If you identify what you want to learn from your users and design your panels accordingly to solicit adequate feedback, your storyboards will translate abstract insights into measurable and accurate data.
Author

Physical products are often tested as tangible prototypes, for example: does this food processor accomplish its task? However, when it comes to evaluating a service concept this proves more difficult: does this experience of buying an insurance plan meet your needs?
Unlike the design and user-testing for a physical product, difficulties arise in effectively communicating and validating a service concept with users in its early stages of development. To solve this, designers need a tool that visually combines the many different aspects of a service to generate measurable and accurate results for prototyping an end-to-end experience.
Storyboards are an engaging and entertaining tool used by service designers to help visualize a complex process where multiple interactions can occur. This includes interactions between different actors, users, and touchpoints within a service. At Bridgeable, we worked with a large corporation who wanted to understand their customers’ ideal channel experience. We used storyboarding as one of the main methods to identify and validate insights throughout the project.
Based on our initial research, we wanted to compare two types of channel experiences: a digital self-serve experience and one that included more personal interactions. To achieve this, we created a form of A/B testing with storyboards to walk our users through during the co-creation workshop. The data we collected gave us a clearer idea of the type of experience our users preferred, and their desired channels throughout the customer experience.
In this article, we’ll share some tips that we applied throughout our project to test our insights through storyboarding. These tips will help you achieve accurate results, and allow you to maintain efficiency throughout the process.
TIP #1: Identify what you want to learn from the users, and make sure it’s apparent in your narrative
With storyboards, you have the flexibility to tell the story based on what you’re hoping to learn from your participants. Storyboards work with any level of detail you choose; for example, illustrating the end-to-end experience to receive input on the overall service, or zooming in on a stage of the experience and validating a certain touchpoint interaction.
Since users’ channel preference was the main variable we were testing, we made sure that the interactions between the customer and provider were the focus of each panel. Some visual ways to emphasize the main variable include adjusting its size, composition, or level of detail and colour.

By solely focusing on the interactions between the user and the provider, we could gather useful and relevant data from the participants.
TIP #2: Keep in mind the aftermath of the workshop; present the storyboards in a way that makes synthesis easy
It’s helpful to present the storyboards and facilitate the activities in a way that makes it easy to collect the data afterward and immediately see patterns. Curate the storyboards where participants are generating data in an organized and visual way, so half of the work is already done for you when it comes the time to gather all the data to synthesize.
At the co-creation workshop, we created a large printout of the storyboards for the two hypothesized experiences that participants could walk through. We instructed participants to use dot stickers to vote for their preferred panel at each stage. From that, a heat map was generated allowing us to quickly identify whether participants preferred a digital self-serve experience over a more personal one. Since participants voted for their preferred panels at each stage, we could mix and match them to create the ideal channel experience. The heat map allowed us to determine that users wanted a digital self-service early on during sign up, but preferred more personal interactions during the subsequent stages.
After voting, we directed participants to use colour-coded Post-Its to provide further input on what they liked or disliked about each panel. The colour-coding was for our own benefit to distinguish positive from negative comments. The additional comments gave us further insight and validation on the observations we made; for example, we found that participants felt the need to speak to representative about a certain issue instead of resolving it digitally. Their written descriptions as to why they liked or disliked a panel also revealed whether participants were making a biased decision.

By turning the storyboards into a visual heat map, we could quickly identify the users’ preferred channel flow.
TIP #3: For A/B testing, stick to one variable and keep all content consistent
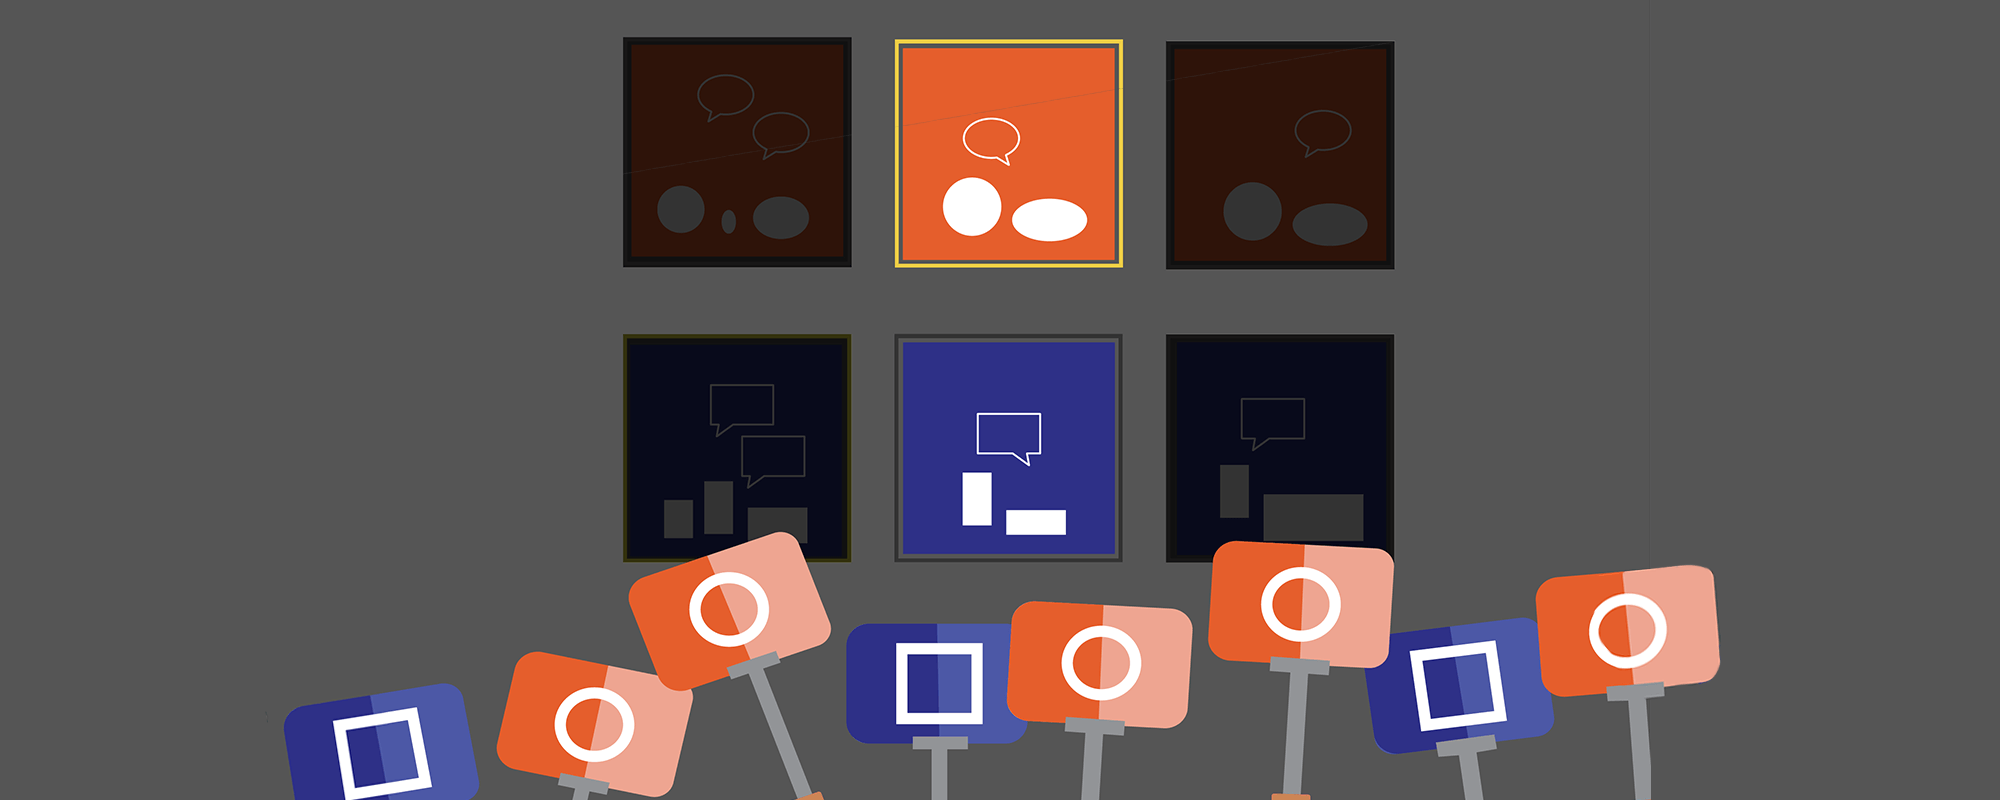
Whether you’re validating the user persona, preferred channel, or experience flow, storyboards are a great way to A/B test two different options. However, to get accurate results, it’s crucial to focus on one changing variable when testing. If the content is inconsistent and doesn’t match across the storyboards, you run the risk of having a participant make a decision based on the wrong reasons. For example, if participants are choosing between two panels, one of which contains information about a discount, this will most likely bias their decision. As shown below, when our team tested the digital experience next to the more personal one, we made sure the channels were distinct enough to choose from, but contained the same information.

Ensuring that all content on the panels matched across each stage decreased the risk of biased decisions and inaccurate results.
TIP #4: Make your imagery and narrative vague enough to solicit feedback
If you’re looking to further develop the user story, your storyboards should be vague yet specific enough to provide cues for the participants to add their input.
We provided participants with a storyboard of an undeveloped experience that we still needed to gather more user insight for. As shown below, the first draft included the different channels the persona interacted with at each stage of the service. However, since we wanted to understand users’ ideal channel preference, we did not include any channels in the second draft to avoid influencing their opinion. The second draft was merely the persona’s thoughts and expressions to give participants an idea of what was going on at each stage. We also prompted participants to add their own input: “My dream experience at this stage is…” Other ways to solicit feedback include blank speech bubbles, unlabeled flowcharts, and asking users to give their personal take on the narrative.

Leaving the panels open-ended in the second draft gave participants the opportunity to add more of their own input; however, the speech bubbles in each panel need to be specific enough to set the scene.
At Bridgeable, incorporating storyboards in our validation process allows us to test insights in a short timeframe and maintain efficiency throughout. These tips streamline the preparation, implementation, and synthesis of testing with storyboards. If you identify what you want to learn from your users and design your panels accordingly to solicit adequate feedback, your storyboards will translate abstract insights into measurable and accurate data.
Author